Feedback
We welcome your feedback on the SoilFinder website site. Please email us at soils@hutton.ac.uk. The old SIFSS/SoilFinder is still available here.
Instructions
1. This site uses a map and a menu tool ('Main menu') to give you access to soil information from the Scottish Soil Database which is hosted by The James Hutton Institute. Please note that this tool has data only for Scotland.
After a few seconds the 1:250,000 soils polygons will be displayed on the map. Navigate the map by panning and zooming to your location. You can double tap to zoom in and pinch out to zoom out, or use the + and - buttons in the top left.  On larger screens there is a button on the top right of the web page that changes the layout to make more room for the map or for this text.
On smaller screens a different button  will appear for you to tap to view instructions which will then be displayed over the map - use the X button in the top right to close this view.
If you are using a mobile phone or tablet to view this page please consider using the Apple or Android app for mobile devices. We have attempted to make the use of this tool similar for all users but small screens makes this difficult.
You can control which map overlays are displayed using the layers button in the bottom right of the map. You can choose between soil maps, a hybrid land capability map and thematic maps. ![]() Information about the layers and the ability to change their appearance is also in this widget - by dragging the layers up and down the list (click and drag on the six-dots button) and controlling their opacity you can view combinations of layers. A widget in the bottom left of the map can be expanded to view the legends of the layers displayed.
Information about the layers and the ability to change their appearance is also in this widget - by dragging the layers up and down the list (click and drag on the six-dots button) and controlling their opacity you can view combinations of layers. A widget in the bottom left of the map can be expanded to view the legends of the layers displayed.
![]() Clicking on the mini maps displayed in the bottom right corner allows you to cycle through different map types and aerial photo overlays.
Clicking on the mini maps displayed in the bottom right corner allows you to cycle through different map types and aerial photo overlays. 
In the upper left of the map are a set of tools to help with finding a location. They include: using the device location (GPS when available); use the search box to enter a place name and the tool will search for matching locations and zoom to your selection; and direct entry of Ordnance Survey National Grid coordinates.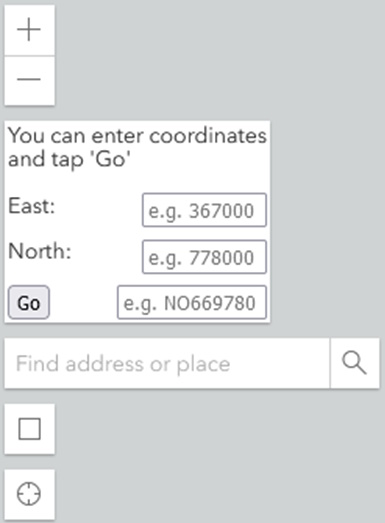
In the upper right of the map there is a toggle button that you can use to switch between using the map to get graphs of the detailed soils information (the default) or alternatively to view information from the map layer you have currently selected to display. 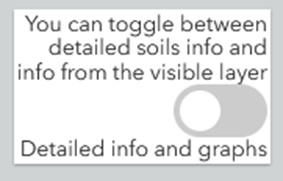 This can include the LCA class.
At the centre of the left edge of the map there is a drag widget that, when you drag from left to right, will remove the main soil maps overlay from the view, this 'Swipe' tool is useful for seeing what lies beneath the soils overlay. You will need to move the Main menu tool to see it.
The main interaction with the page is by using the menu with the blue band at the top labelled 'Main menu'.
The parts of the web page which have a bright blue band at the top (such as 'Main menu') can be moved around the page so that you can view the parts of the map in which you are interested. Hovering your mouse above the blue bar will change the cursor to a cross. You can press and hold your mouse to drag the view to a new location.
On a tablet or phone you can press and hold your finger (or stylus) on the blue panels and then drag them around your screen.
Once you have zoomed to your location of interest click or tap on the map to add a dot that represents your location of interest. The tool will then search for the soils information for the soil type at that location.
2. When SoilFinder has identified the soil map unit it will display the soil types that make up the map unit in the main menu. The soil types are named after the area where they were first found, thus Forfar soils were first mapped around Forfar. The soils are listed under the text beginning 'This soil is composed of...'
In the menu, you will see a small circular button that can be tapped to select a series and the series name underlined. Tapping on the series name will display a brief description of the series to help you to select the one in which you are interested. The characteristics of soils are different depending on their management so a cultivated Countesswells soil is different to a semi-natural Countesswells soil. Please select the option in which you are interested. You are then able to select a range of soil properties for that specific soil type and choose whether to display results for cultivated or semi-natural soils.
At the lower left of the menu is a three-way toggle button to choose between showing only a graph of your chosen attribute, only a diagram of the soil horizon or both diagrams. This function is provided to make using SoilFinder a little easier on smaller screens.
You may add information from a soil sample to the graph by typing in the numerical value in the box provided at the top of the main menu prior to tapping on 'Display Results'.
A graph of your selected soil property, soil series and management option will be displayed to the right of the map. This graph has a bright blue band at the top so it too may be selected and dragged to a new location. Subsequent graphs you generate will have the same facility so that you may readily compare the cultivated and semi-natural properties of a soil or several series within a polygon by viewing graphs side by side. If you are no longer interested in a graph you may remove it from the display using the button provided in its title bar.
If your soil sample has a value for a specific soil property that lies within the box surrounding the red dot (which is the median value), then your soil has a value in the same range as 66% percent of all those particular soil types. If it is outwith the box but lies along the line then it is close to the maximum (above the box) or minimum (below the box) values recorded in our database.
For properties such as pH, carbon content, loss on ignition and calcium content which all affect plant growth, it is important to try to maintain these at optimum levels. If your sample is below the box on the graph, particularly for topsoils (Ap horizons) then you may need to think about adding lime or organic matter to your soil.
You can continue to examine soil properties by tapping again on the map to identify a new soil or by making a new selection on the menu.
This website was created by David Donnelly of the James Hutton Institute, 2023-2025.

